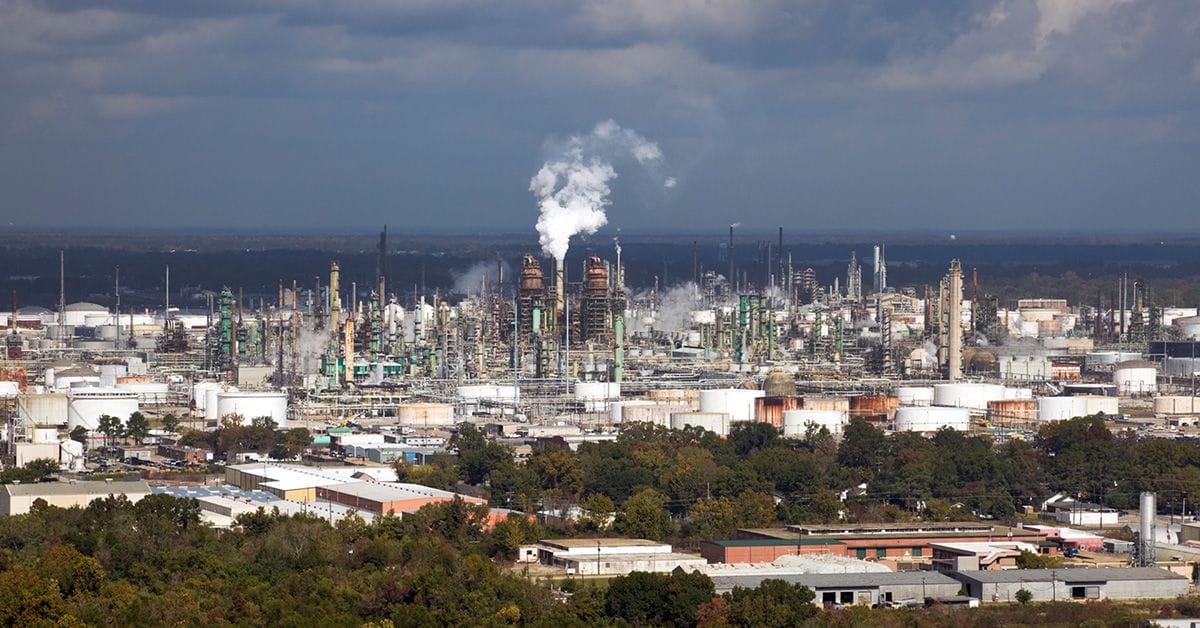
New work has mapped southeastern Louisiana’s petrochemical industrial corridor—known as "Cancer Alley"—with interesting findings that could advance sampling and monitoring approaches.

Ethylene oxide is used as a petrochemical feedstock for commercial chemicals, as well as a sterilizing and fumigating agent for medical equipment and food safety. In 2016, the worldwide ethylene oxide production was 34.5 million tons, with compound annual growth of 4.3% between 2011 and 2016, and projected to continue increasing.1 But this volatile organic compound (VOC) is a known human carcinogen associated with leukemia, myeloma, lymphoma, and breast cancer—and is also considered mutagenic.2 Importantly, this carcinogenic potential is extremely high relative to other common hazardous VOCs, and even low levels of chronic exposure pose substantial risks. Yet both its toxicity and how it should be regulated are the source of much debate. There are also analytical challenges to collecting the supporting data, with current methods deemed expensive and failing to capture short temporal or spatial variations.
Now, new work in Louisiana's petrochemical industrial corridor has employed two commercial optical instruments on mobile platforms to measure ethylene oxide as part of the Hazardous Air Pollutant Monitoring and Assessment Project (HAP-MAP).3 This stretch of land in the United States runs 160 km along the Mississippi River from Baton Rouge to New Orleans and is home to around 1.6 million people. The larger HAP-MAP project is an effort to measure a wide range of hazardous air pollutants in both gas- and particle-phase where heavy industry is adjacent to local communities, with the ultimate goal of assessing exposure and related health risks.
The ethylene oxide research, published in Environmental Science & Technology, showcases data highly relevant to the local communities, as well as to the growing literature around measurement and impact of this specific VOC. To achieve this, two instruments were mounted on to mobile laboratories: an Aerodyne tunable infrared laser direct absorption spectrometer (TILDAS), and a Picarro G2920 cavity ringdown spectrometer (CRDS).
The results give an analysis of ethylene oxide plumes and highly spatially resolved estimates of ethylene oxide mixing ratios across the region. From these estimates, the team was able to perform a spatial analysis of mixing ratios within different land-use categories based on proximity to industrial point sources, as well as a comparison of census tract-level estimates between the mobile measurements and modeled mixing ratios from the United States’ Environmental Protection Agency’s (EPA) Air Tox Screen.4 Ethylene oxide plumes were identified up to 11.4 kilometers away from likely sources, and with mixing ratios corresponding to risk levels above the EPA’s acceptable upper limit.

Ethylene Oxide in Southeastern Louisiana’s Petrochemical Corridor: High Spatial Resolution Mobile Monitoring during HAP-MAP
DOI: 10.1021/acs.est.3c10579
It is noteworthy that, across a region colloquially termed “Cancer Alley,” around 68% of the total facility-level air pollutant-related hazard was attributed solely to ethylene oxide. The authors note that "the fact that so much of the environmental risk in this area seems to come from a single chemical is remarkable." Their findings provide important information about ethylene oxide concentrations and potential exposure risks in a key industrial region, and this information could be used to advance the application of analytical methods for ambient sampling and mobile monitoring for toxic compounds in the air.
Mobile ambient air quality monitoring is rapidly changing the landscape for monitoring, becoming an important tool to address air quality and climate data gaps across the globe. A 2023 systematic review and meta-analysis explores this topic in more detail and looks at key trends of mobile ambient air quality monitoring.5
Air pollution drives poor health and mortality, and pollution measurements are crucial for epidemiology and air quality management, but the extent of ground-based air pollution observations is limited. Previous work has trialed using Google Street View cars to help exploit Big Data and generate high-resolution air pollution maps.6 Routine monitoring fleets aren’t a new idea, but even purpose-built mobile labs are rarely deployed for extended periods, and often depend on using trained research staff as drivers. The difference here is to equip professionally driven fleet vehicles with air quality instruments, allowing them to repeatedly sample every street in an urban area, and then apply data reduction algorithms to distill stable long-term spatial patterns from time-resolved data. The findings from these kind of analyses have broad societal consequences. For example, high-resolution pollution maps might raise public awareness, and drive shifts in urban land-use decisions, regulatory actions, or political decisions.

Stay Connected with Environmental Science & Technology
- Pu, T. et al. Overview of Selective Oxidation of Ethylene to Ethylene Oxide by Ag Catalysts. ACS Catal. 2019, 9, 10727–10750.
- U.S. Environmental Protection Agency. Evaluation of the Inhalation Carcinogenicity of Ethylene Oxide In Support of Summary Information on the Integrated Risk Information System (IRIS), 2016.
- Robinson, E. S. et al. Ethylene Oxide in Southeastern Louisiana’s Petrochemical Corridor: High Spatial Resolution Mobile Monitoring during HAP-MAP. Environ. Sci. Technol. 2024, 58, 25, 11084–11095.
- U.S. Environmental Protection Agency. 2019 Air Toxics Screening Assessment, 2022.
- Wang, A. et al. Key Themes, Trends, and Drivers of Mobile Ambient Air Quality Monitoring: A Systematic Review and Meta-Analysis. Environ. Sci. Technol. 2023, 57, 26, 9427–9444.
- Apte, J. S. et al. High-Resolution Air Pollution Mapping with Google Street View Cars: Exploiting Big Data. Environ. Sci. Technol. 2017, 51, 12, 6999–7008.
